Ecology Center
Elsie Lee-RobbinsSeptember - December 2024
In Fall 2023, I joined the Ecology Center in Ann Arbor as a Communications Fellow. The Ecology Center is a local nonprofit that advocates for environmental justice issues for healthy people and a healthy planet. To do this, they research toxic chemicals in everyday products in their Healthy Stuff Lab, work with policymakers for environmental protection policies, and put pressure on corportations to make safer products and use clean energy.
Receipt deceipt
My role at the Ecology Center was part of the communications team, but we collaborated with teams across the organization to help communicate their research and advocacy work. The audiences and contexts for our graphics ranged from eye-catching social media visualizations to in-depth analytical charts for policymakers.
This graphic was created for social media, to quickly convey the takeaway that 4 out of 5 receipts had toxic chemicals in them. Our Receipt Deceit report was used to educate consumers on how to safely handle receipts (tldr; don't touch them when wet, especially if you are pregnant) and to ask stores to switch to non-toxic alternatives or digital receipts.

Lead poisoning in children
By collaborating across the organization, I had the opportunity to learn more about a wide variety of topics, such as toxic chemicals in receipts, PFAS, electric vehicles, lead poisoning, sustainable procurement, and climate justice. We focused on both the environmental issues and potential solutions.
To communicate lead poisoning throughout our state, I created a map of Michigan to highlight which counties have high levels of lead poisoning. I chose to visualize the data normalized to the population to show that this is a problem across Michigan, including the Upper Peninsula and rural areas, not just Detroit and Flint. This visual was part of a report to communicate the benefits of Lead Remediation to policymakers.

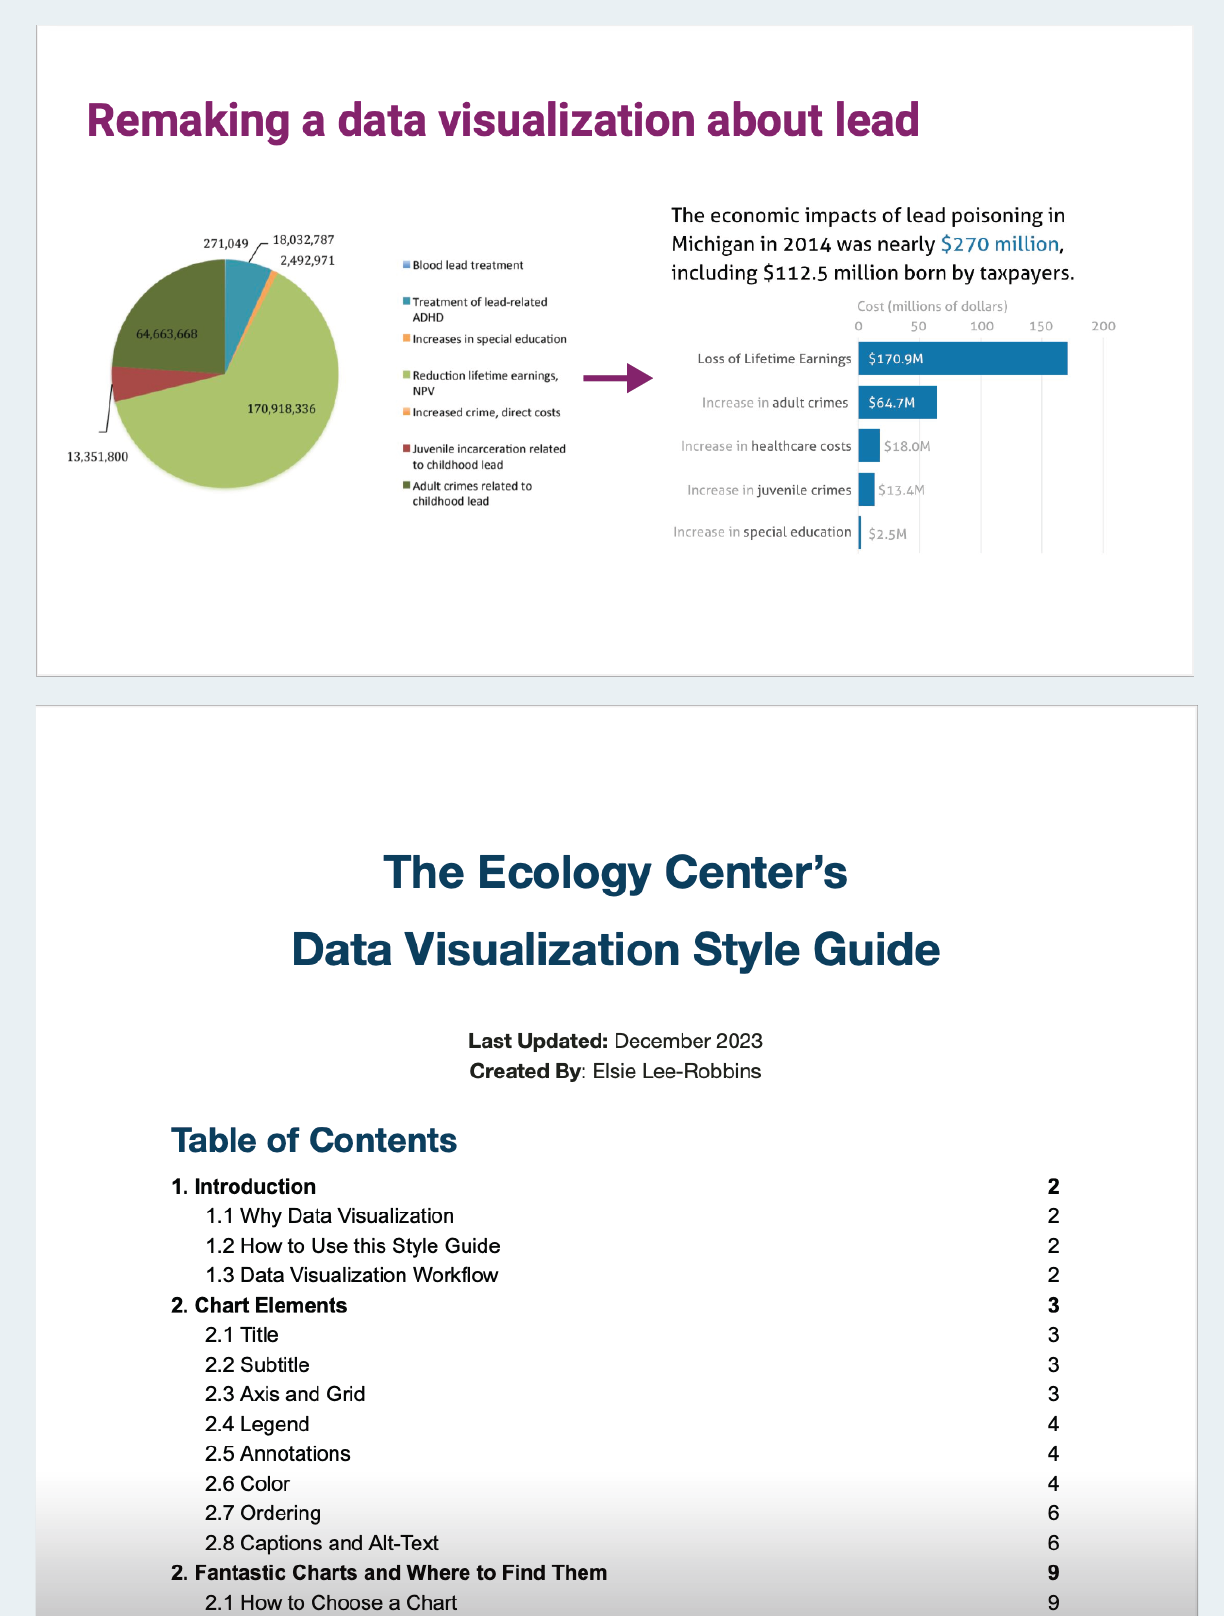
Dataviz style guide and workshop
As a data visualization specialist, I designed a bespoke workshop to teach the communications team and project areas about data visualizations. I covered the key principles of data visualization, how apply them to advocacy and communication, and how data visualization can be leveraged specifically at the Ecology Center. I presented this workshop to 5 people from the communication team and 8 people from the project areas.
Additionally, I created a set of brand standards and best practices of data visualizations for the Ecology Center to use going forward. Not only does this resource build upon the organization's brand standards to continue a cohesive look and feel for the Ecology Center's brand, it also focuses on best practices for data design, to guide future products that are both visually engaging and effective at communicating insights.

Advocacy and policymakers
The Ecology Center collaborates with coalitions at the local, state, and national level. Engaging with our partners across the state, we joined the Michigan Environmental Justice Council to advocate for a future fueled by clean energy. Though I only joined the Ecology Center for a semester, they have been driving environmental protection policies for 50 years. It was rewarding to see the Ecology Center work have a real impact on policy, such as the Filter First policy to install lead water filters in all schools and daycares!
