Bullet Journal Data Visualization
Elsie Lee-Robbins2022
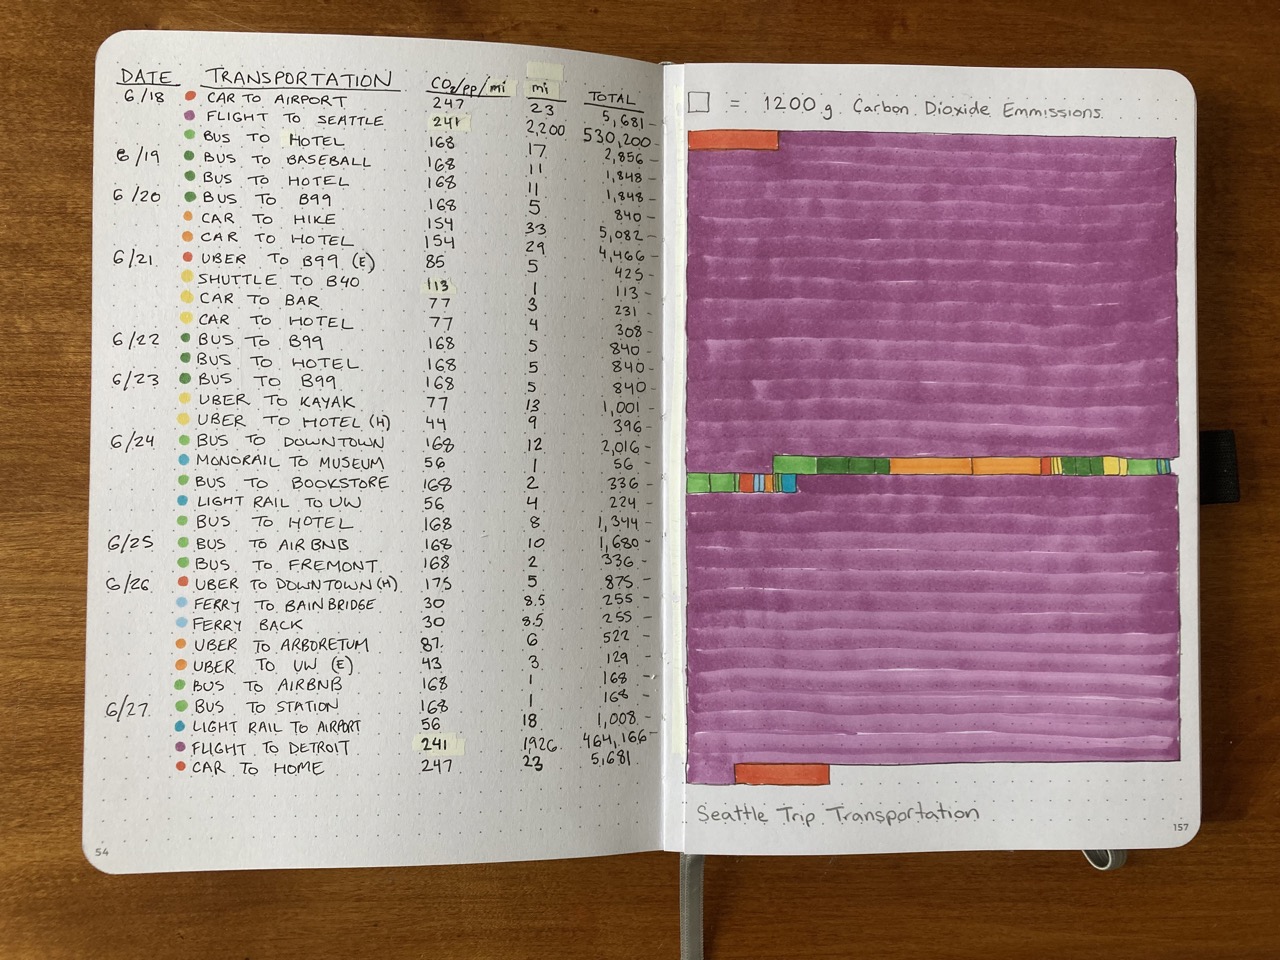
I made a data visualization of the 34 transportation rides I took for visiting Seattle for 10 days for my Microsoft internship. The data is on the left, visualization of carbon emissions on the right.